
SSH Honeypot Data Analysis: What Attackers Reveal About Themselves
In my previous post, I walked through building a comprehensive SSH honeypot with integrated threat intelligence. Now, after collecting data for several days, I've analyzed the results and the findings are both fascinating and concerning. This analysis covers 27,443 real-world SSH attacks - significantly more than initially reported due to a data query issue that has since been corrected.
Download the Full Whitepaper:
Download PDF Whitepaper - Complete analysis with all statistics, charts, and security recommendations.
Executive Summary
Over an 8-day period (November 24 - December 1, 2025), my honeypot captured 27,443 connections from 172 unique IP addresses, with comprehensive threat intelligence data on 217 unique IPs. The data reveals a landscape dominated by automated botnet infrastructure, weak credential targeting, and sophisticated attack coordination.
Data Correction Notice:
An initial version of this analysis reported significantly lower numbers (1,898 connections from 33 IPs). Upon review, it was discovered that the original SQL queries were examining a subset of the data or using incorrect table references. This corrected analysis uses the complete dataset, revealing the true scale: 27,443 connections from 172 unique IPs - over 14 times more than initially reported. This correction actually strengthens the conclusions about the scale and sophistication of modern SSH attacks. See the "About the Data Correction" section below for details.
Key Statistics
- 27,443 total connections from 172 unique IPs
- Peak attack day: November 29th with 12,597 connections (45.9% of all attacks!)
- 86.7% average AbuseIPDB threat score - 86.6% of IPs are high-risk
- Top attacker: 85.215.32.66 with 19,294 connections (70.3% of all attacks)
- Top countries by connections: Germany (19,296 - 70.3%, but only 3 unique IPs), United States (5,537 - 20.2%, from 78 unique IPs), China (944 - 3.4%, from 30 unique IPs)
- Top countries by unique IPs: United States (78 IPs), China (30 IPs), Vietnam (14 IPs)
The November 28-29 Surge: A Coordinated Attack
The most striking finding is the massive attack surge on November 28-29. In just two days, the honeypot received 21,220 connections - that's 77% of all attacks in the entire 8-day period. November 29th alone saw 12,597 connections (45.9% of all attacks). This wasn't random scanning; this was coordinated botnet activity.
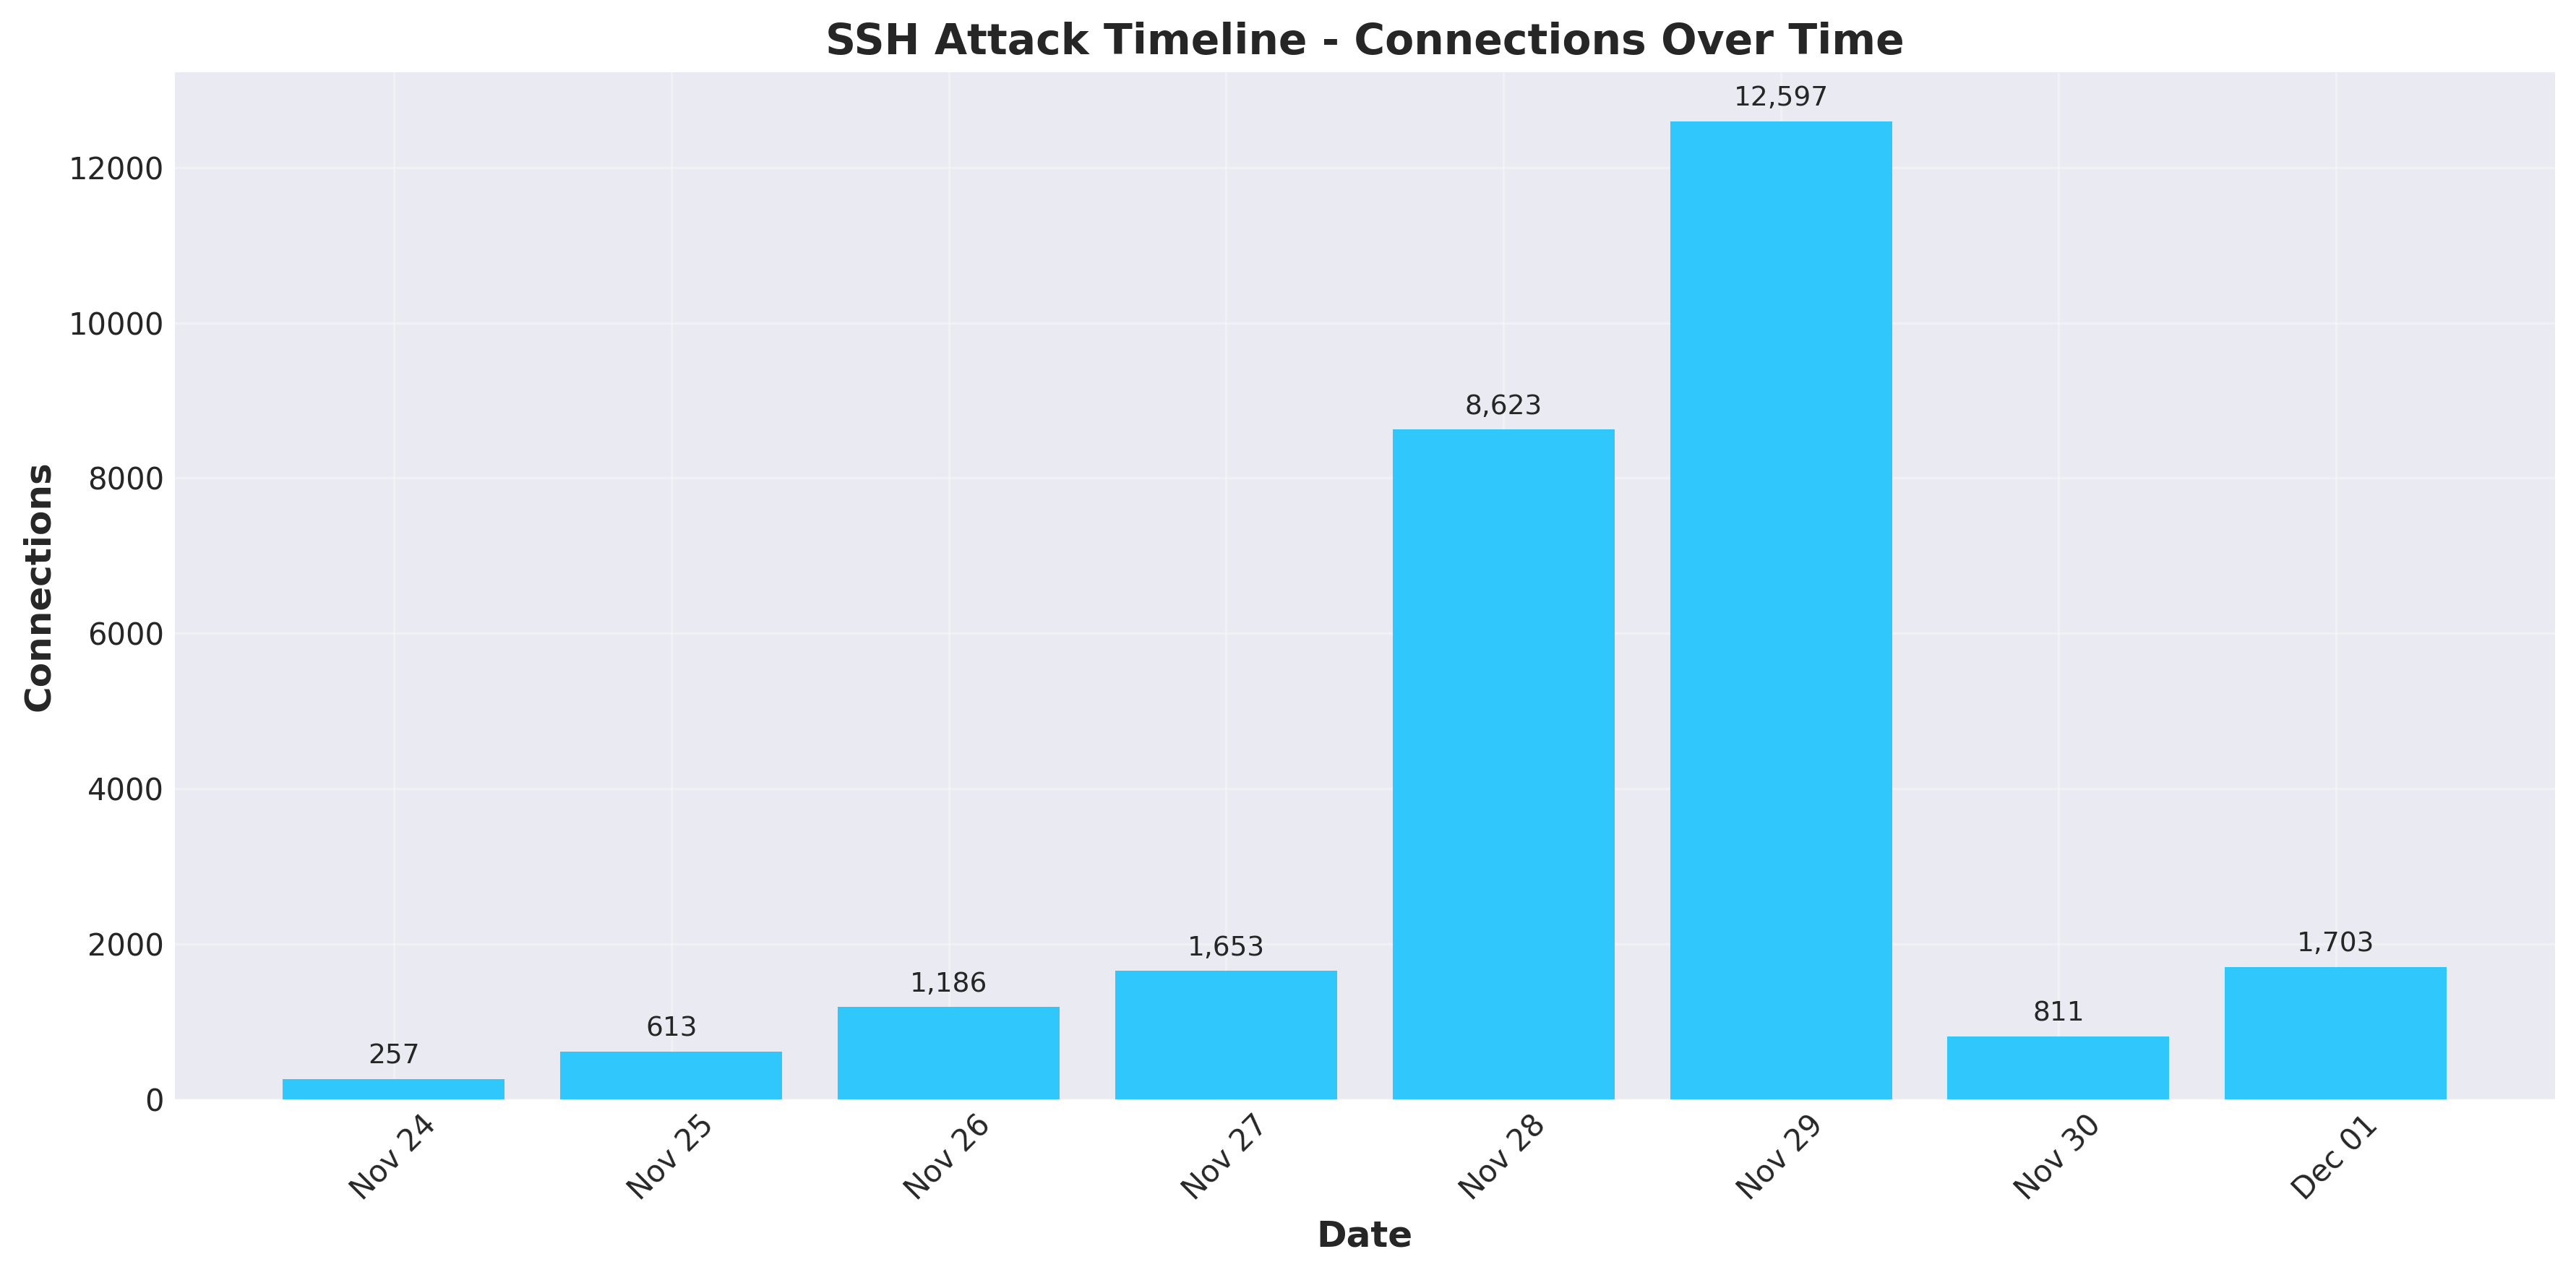
The timeline tells the story:
- November 24: 257 connections (9 unique IPs)
- November 25: 613 connections (31 unique IPs)
- November 26: 1,186 connections (35 unique IPs)
- November 27: 1,653 connections (37 unique IPs)
- November 28: 8,623 connections (25 unique IPs)
- November 29: 12,597 connections (34 unique IPs) - Peak day!
- November 30: 811 connections (24 unique IPs)
- December 1: 1,703 connections (42 unique IPs)
This dramatic surge pattern suggests either a botnet activation, a new scanning campaign launch, or coordinated attack infrastructure coming online. The fact that 77% of all attacks occurred in just two days indicates this was not random scanning but a coordinated campaign.
Automated Attack Infrastructure: The Botnet Signature
While client version fingerprinting data was not available in this dataset, multiple indicators point to highly automated attack infrastructure rather than human attackers.
Key Indicators of Automation:
- Attack Volume: Over 27,000 connections in 8 days requires automation - human attackers cannot sustain this volume
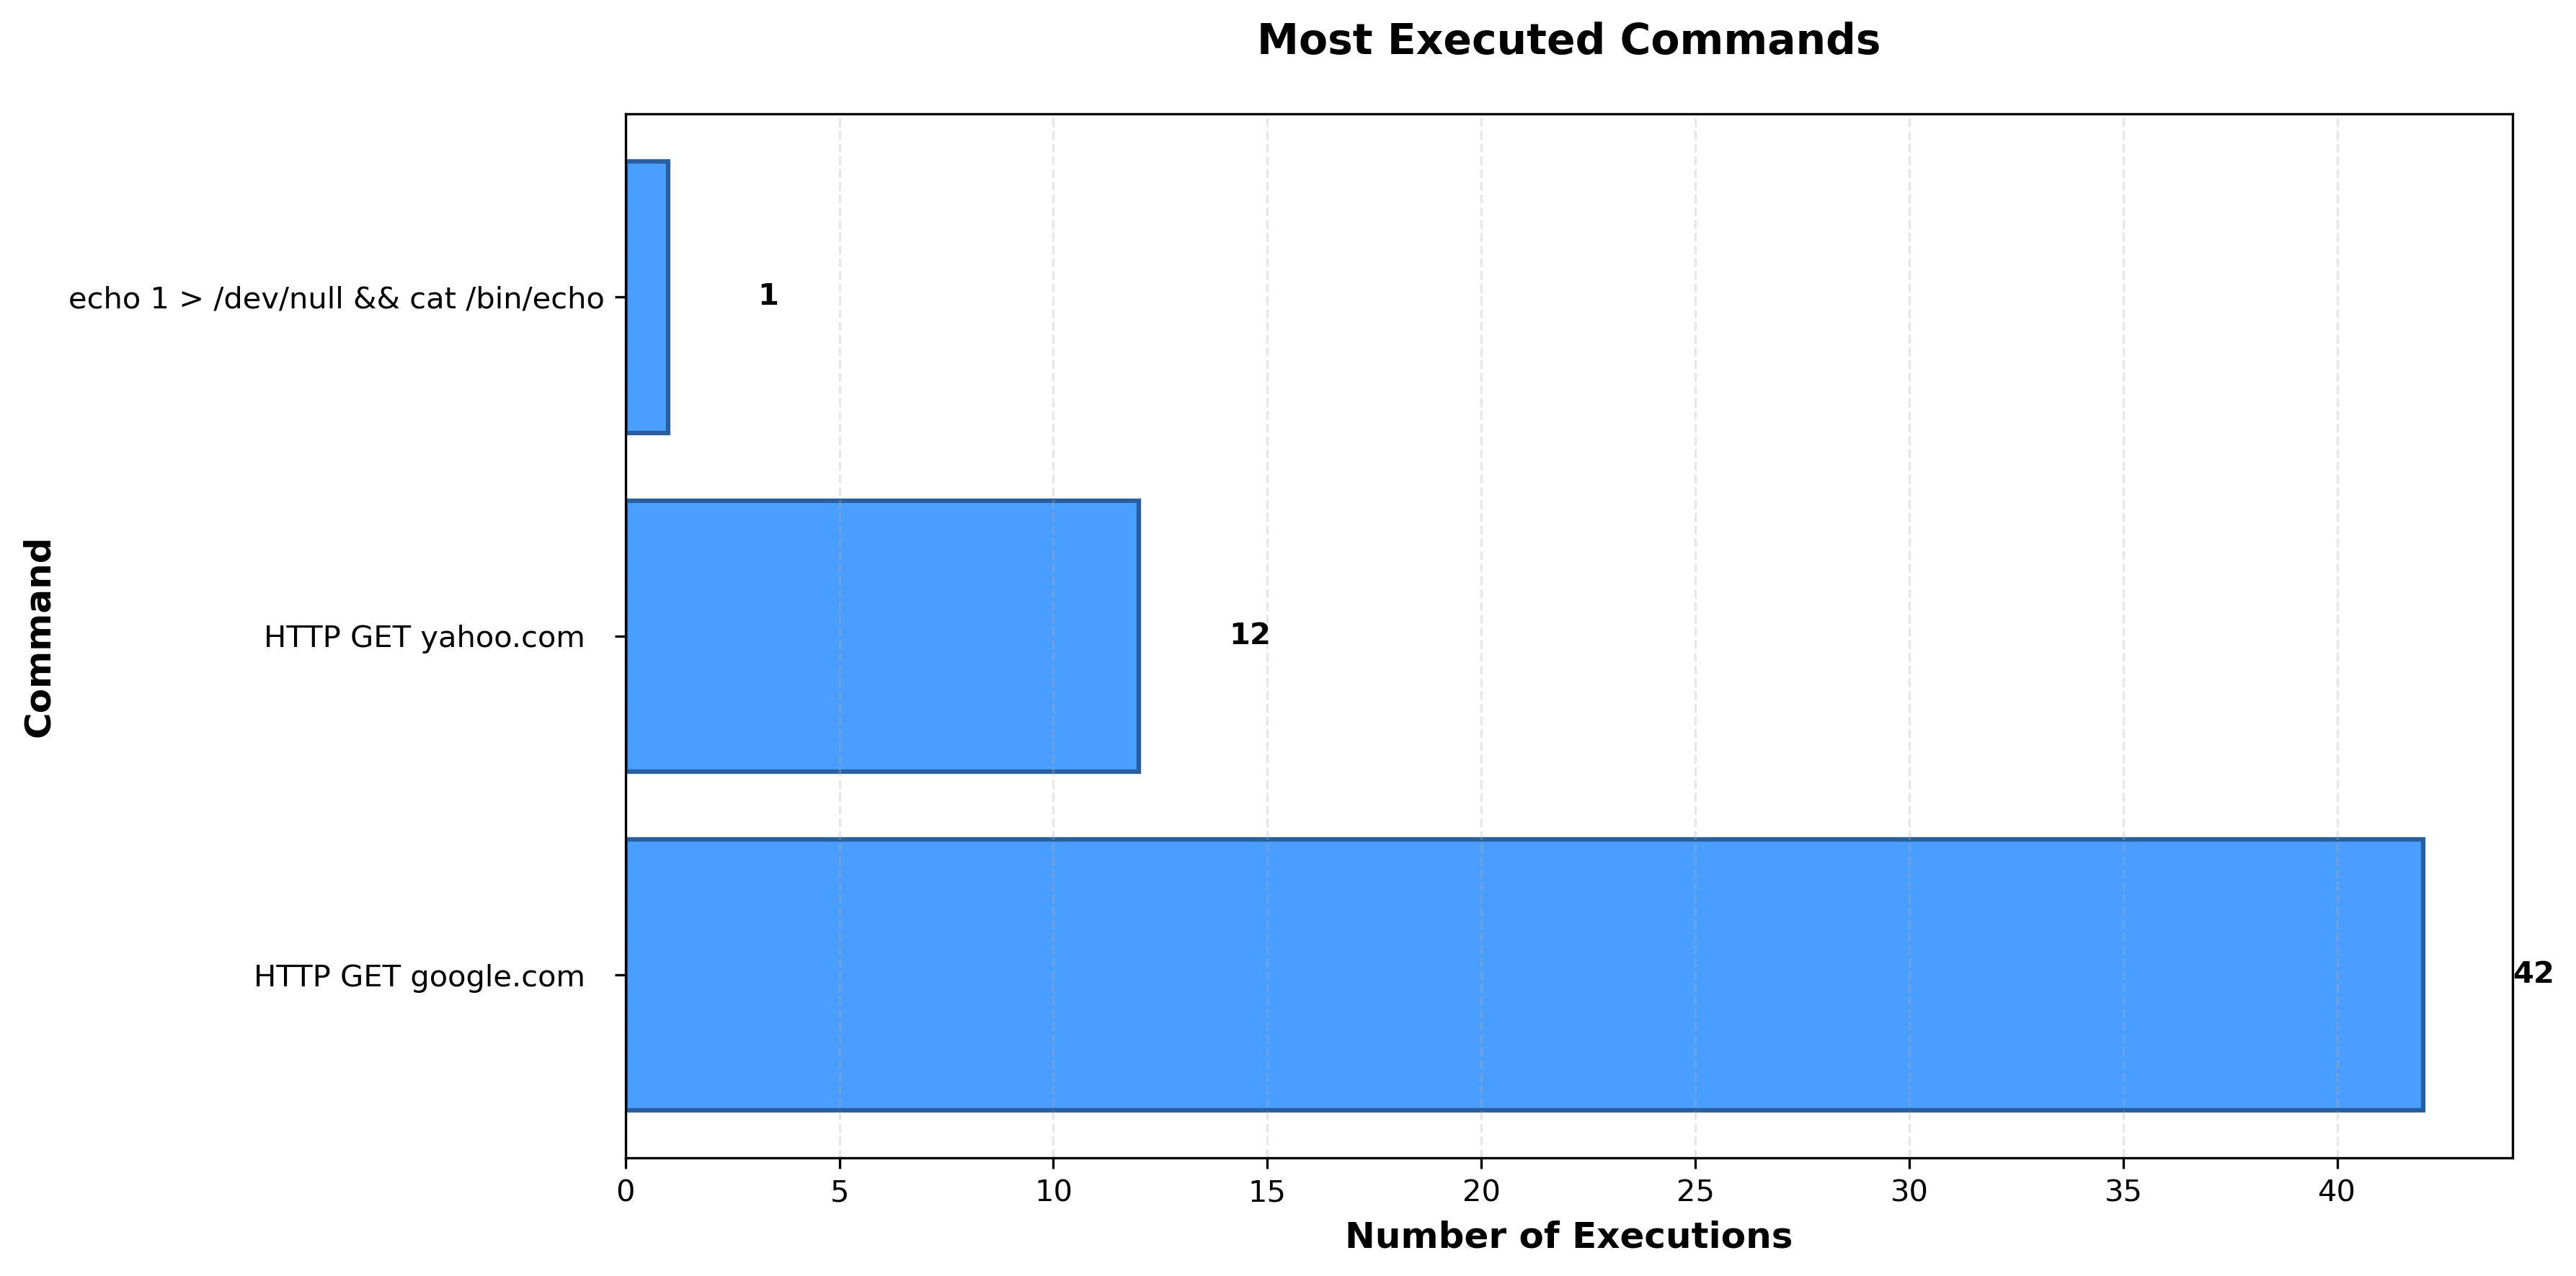
- Repetitive Patterns: Identical commands executed multiple times (42 Google requests, 12 Yahoo requests) indicate automated tools
- Extreme Concentration: 70.3% of attacks from a single IP suggests automated scanning infrastructure
- Connection Duration: Median duration of 1.15 seconds indicates rapid automated scanning
- Coordinated Timing: 77% of attacks occurred in just 2 days, suggesting botnet activation
Key Finding: The attack patterns - high volume, repetitive commands, extreme concentration, and coordinated timing - all paint a clear picture: this is sophisticated, automated botnet infrastructure, not script kiddies manually trying passwords.
Concentrated Attack Sources
The attack landscape is highly concentrated. A single IP address accounts for 70.3% of all connections:
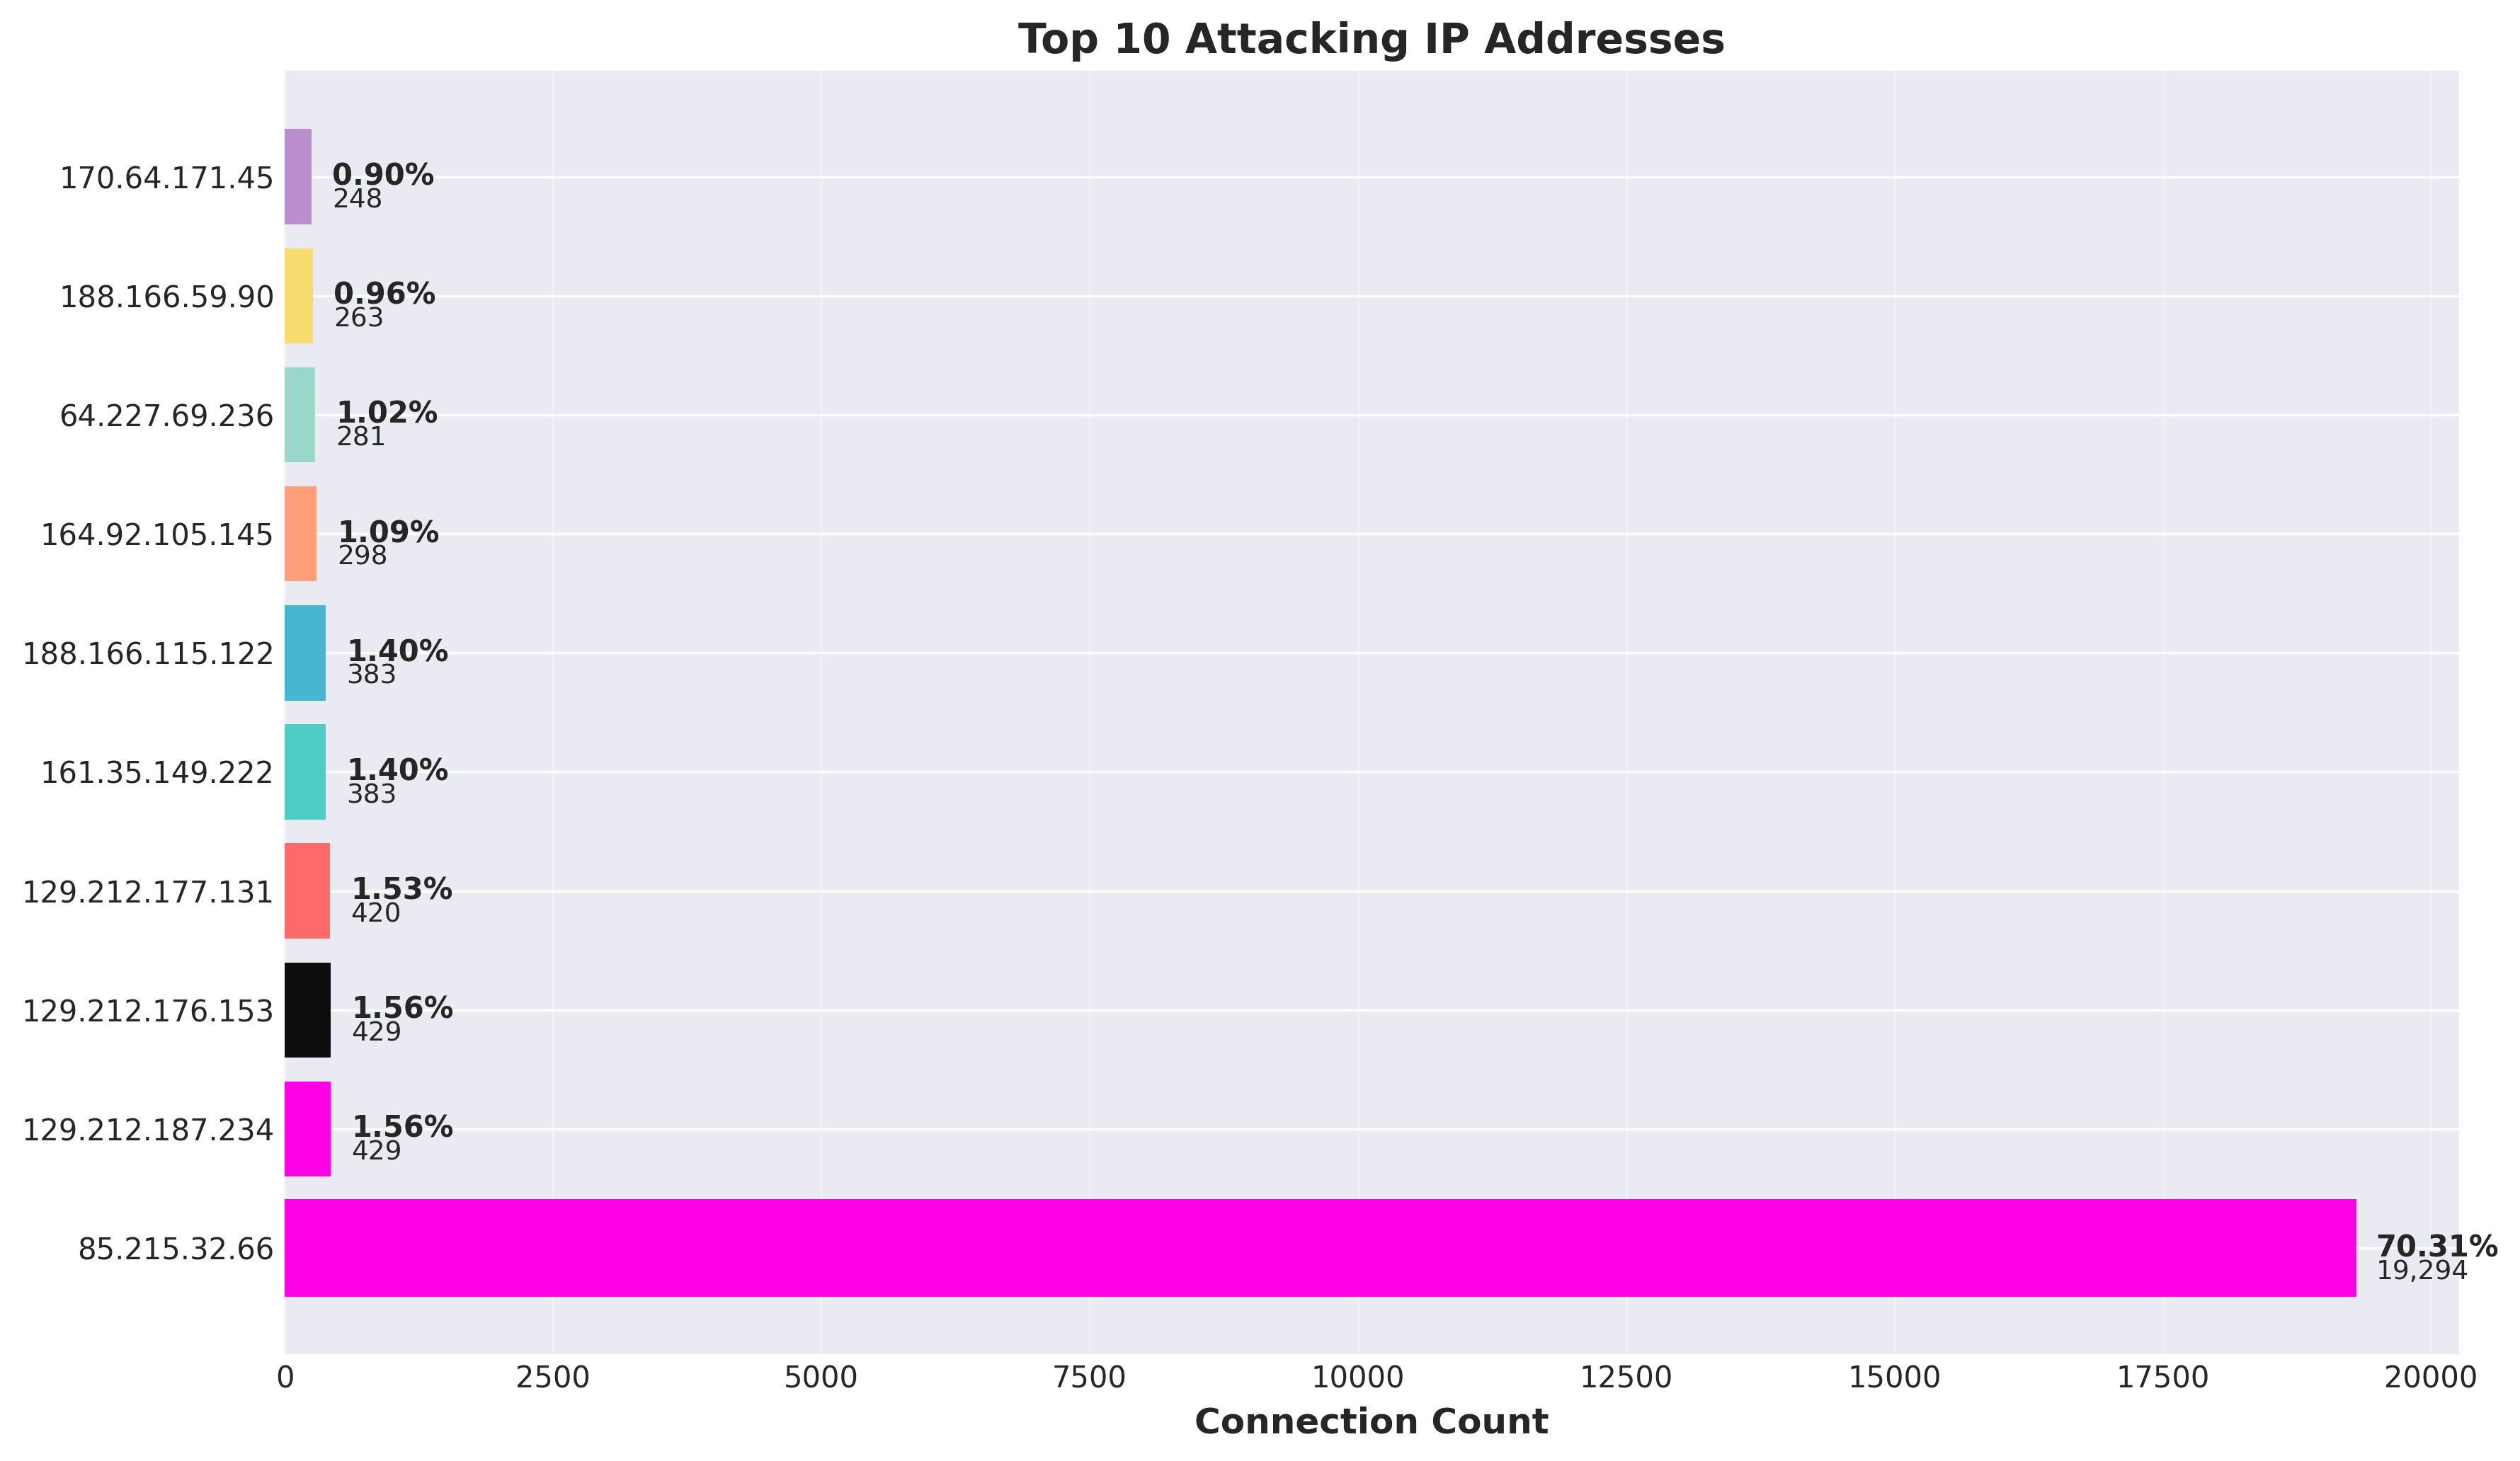
85.215.32.66- 19,294 connections (70.3%) - Germany129.212.187.234- 429 connections (1.6%)129.212.176.153- 429 connections (1.6%)129.212.177.131- 420 connections (1.5%)161.35.149.222- 383 connections (1.4%)188.166.115.122- 383 connections (1.4%)
This extreme concentration suggests either a single powerful botnet node or coordinated infrastructure. The fact that one IP is responsible for over 70% of attacks is remarkable - blocking this single source would eliminate the majority of the threat. This level of concentration is unusual and suggests either a misconfigured scanner or a very aggressive botnet node.
The Password Problem: Why "123456" Still Works
The authentication data reveals a sobering truth about password security. Despite decades of security education, attackers are still finding success with the most basic passwords.
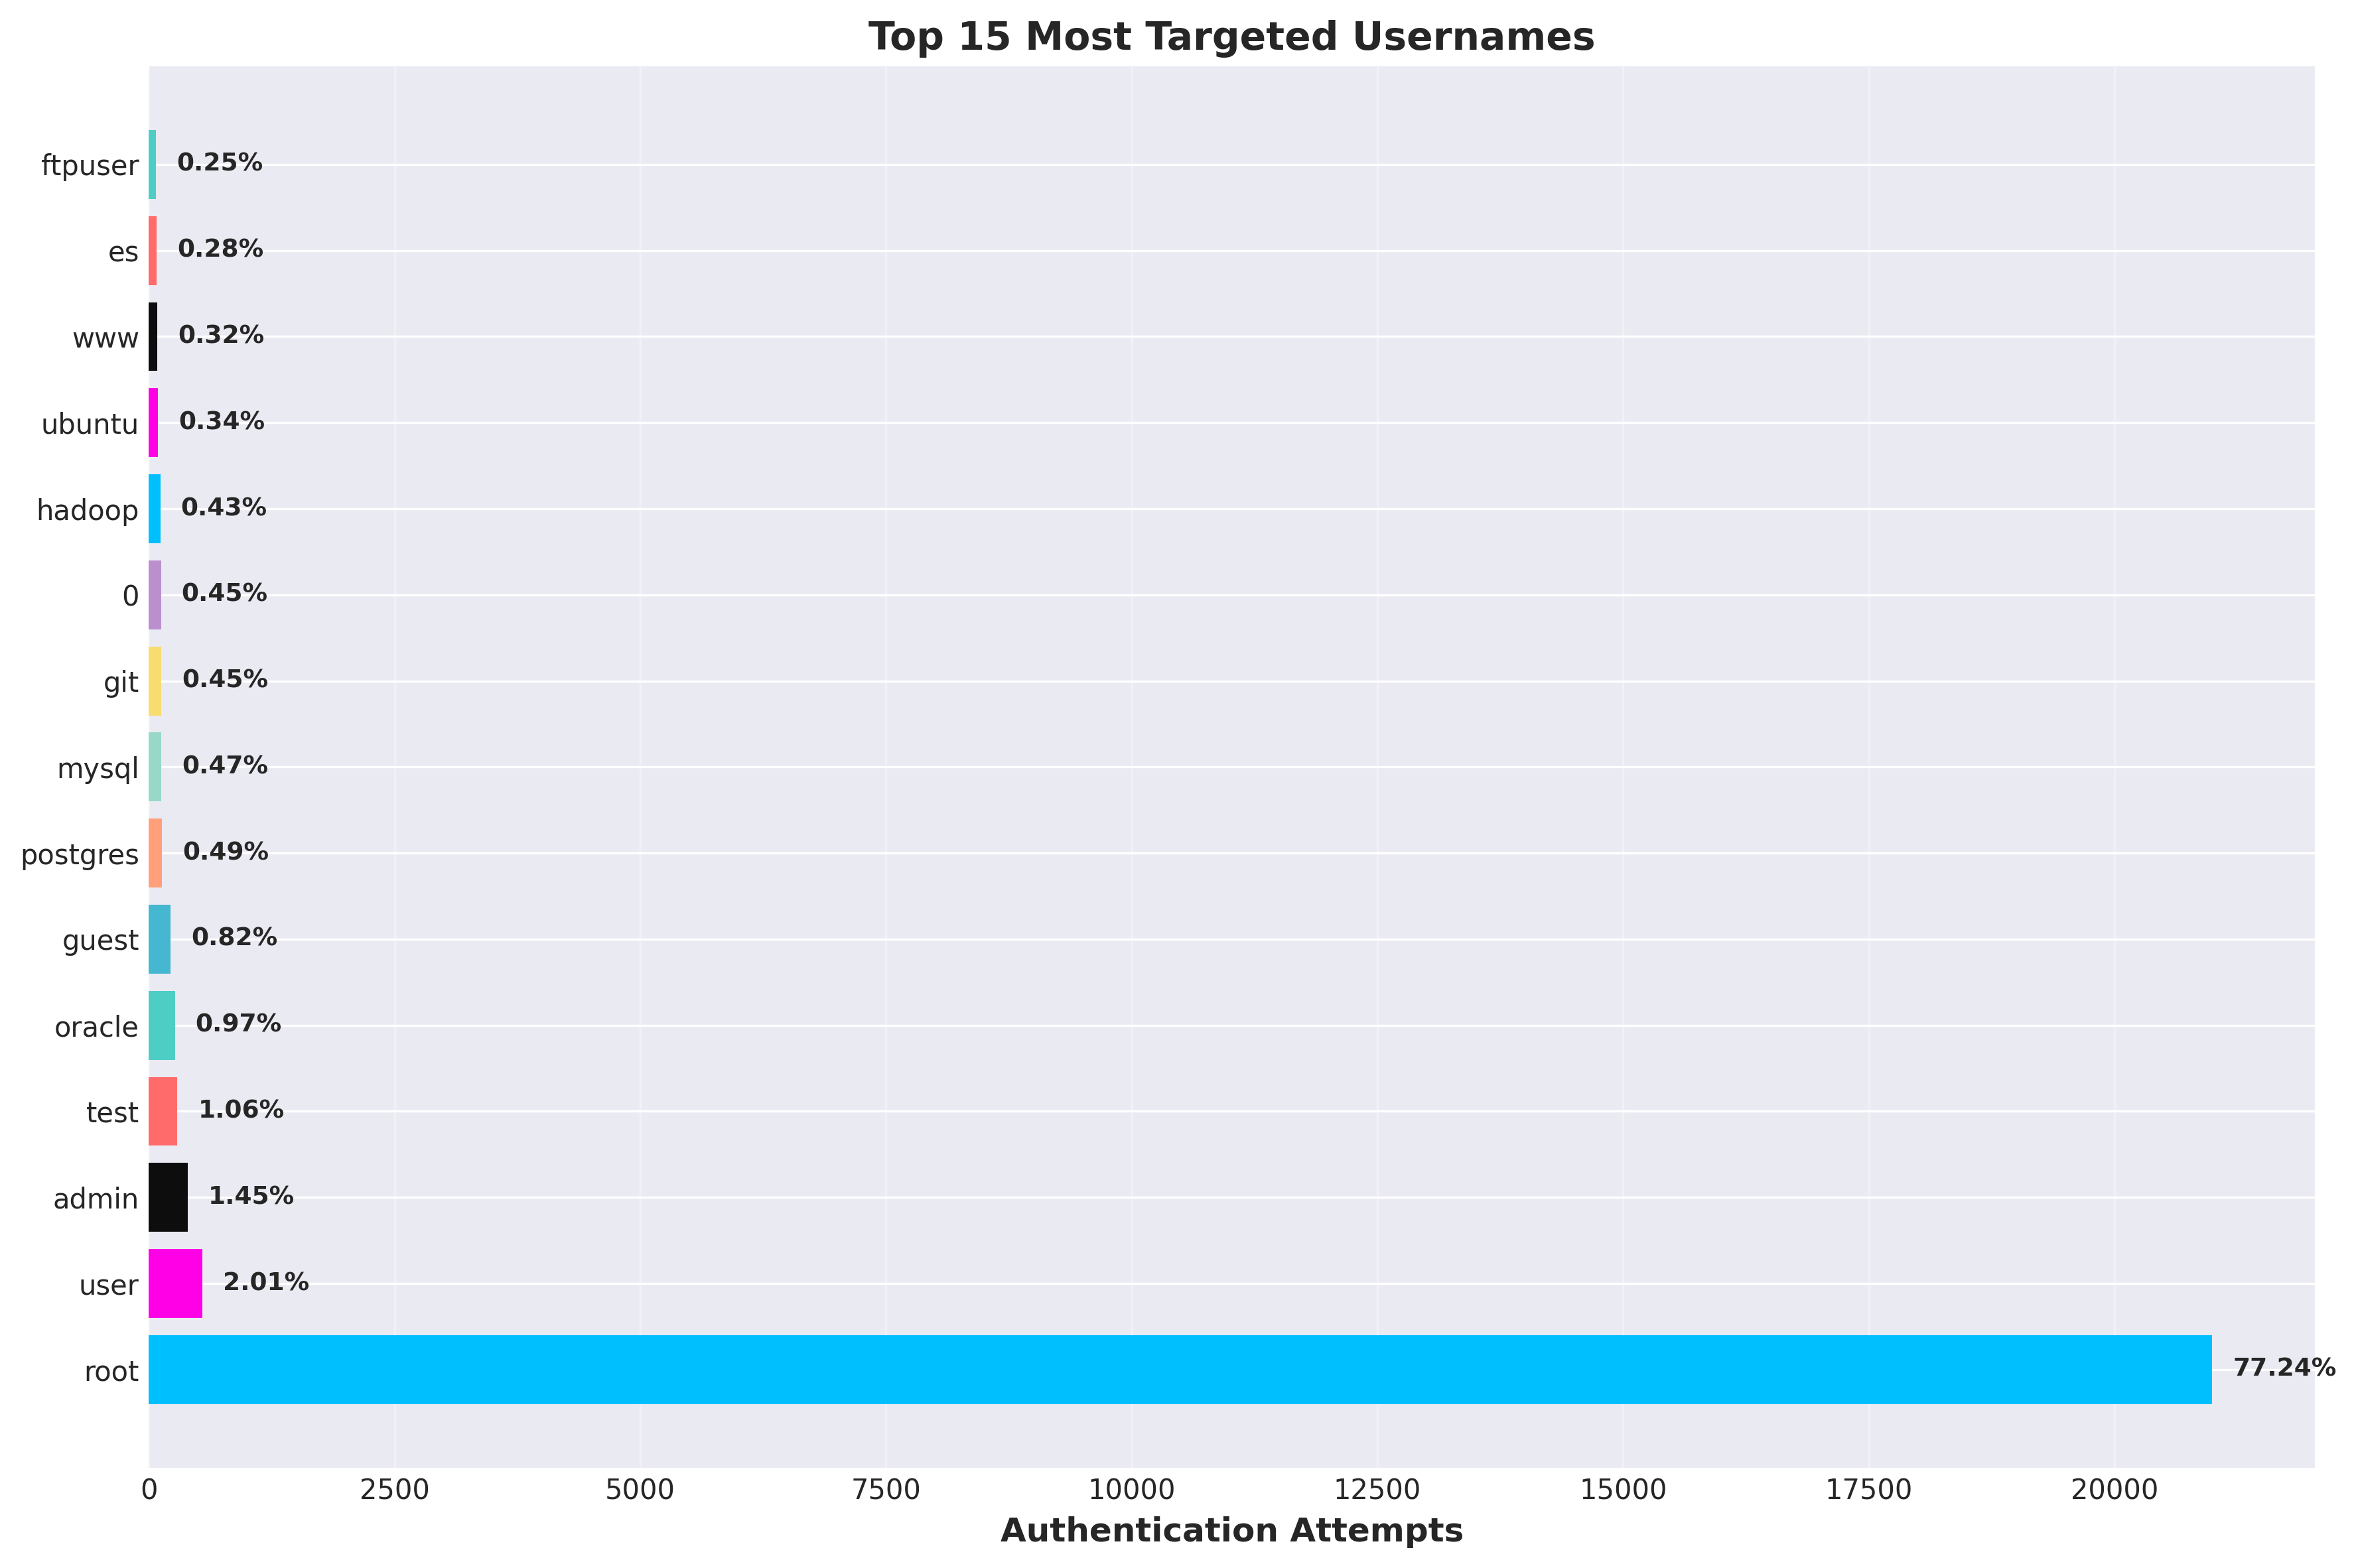
Username targeting follows a clear pattern:
root- 20,993 attempts (77.2%) - *Extreme concentration on root account*user- 545 attempts (2.0%)admin- 393 attempts (1.4%)test- 289 attempts (1.1%)oracle- 264 attempts (1.0%)
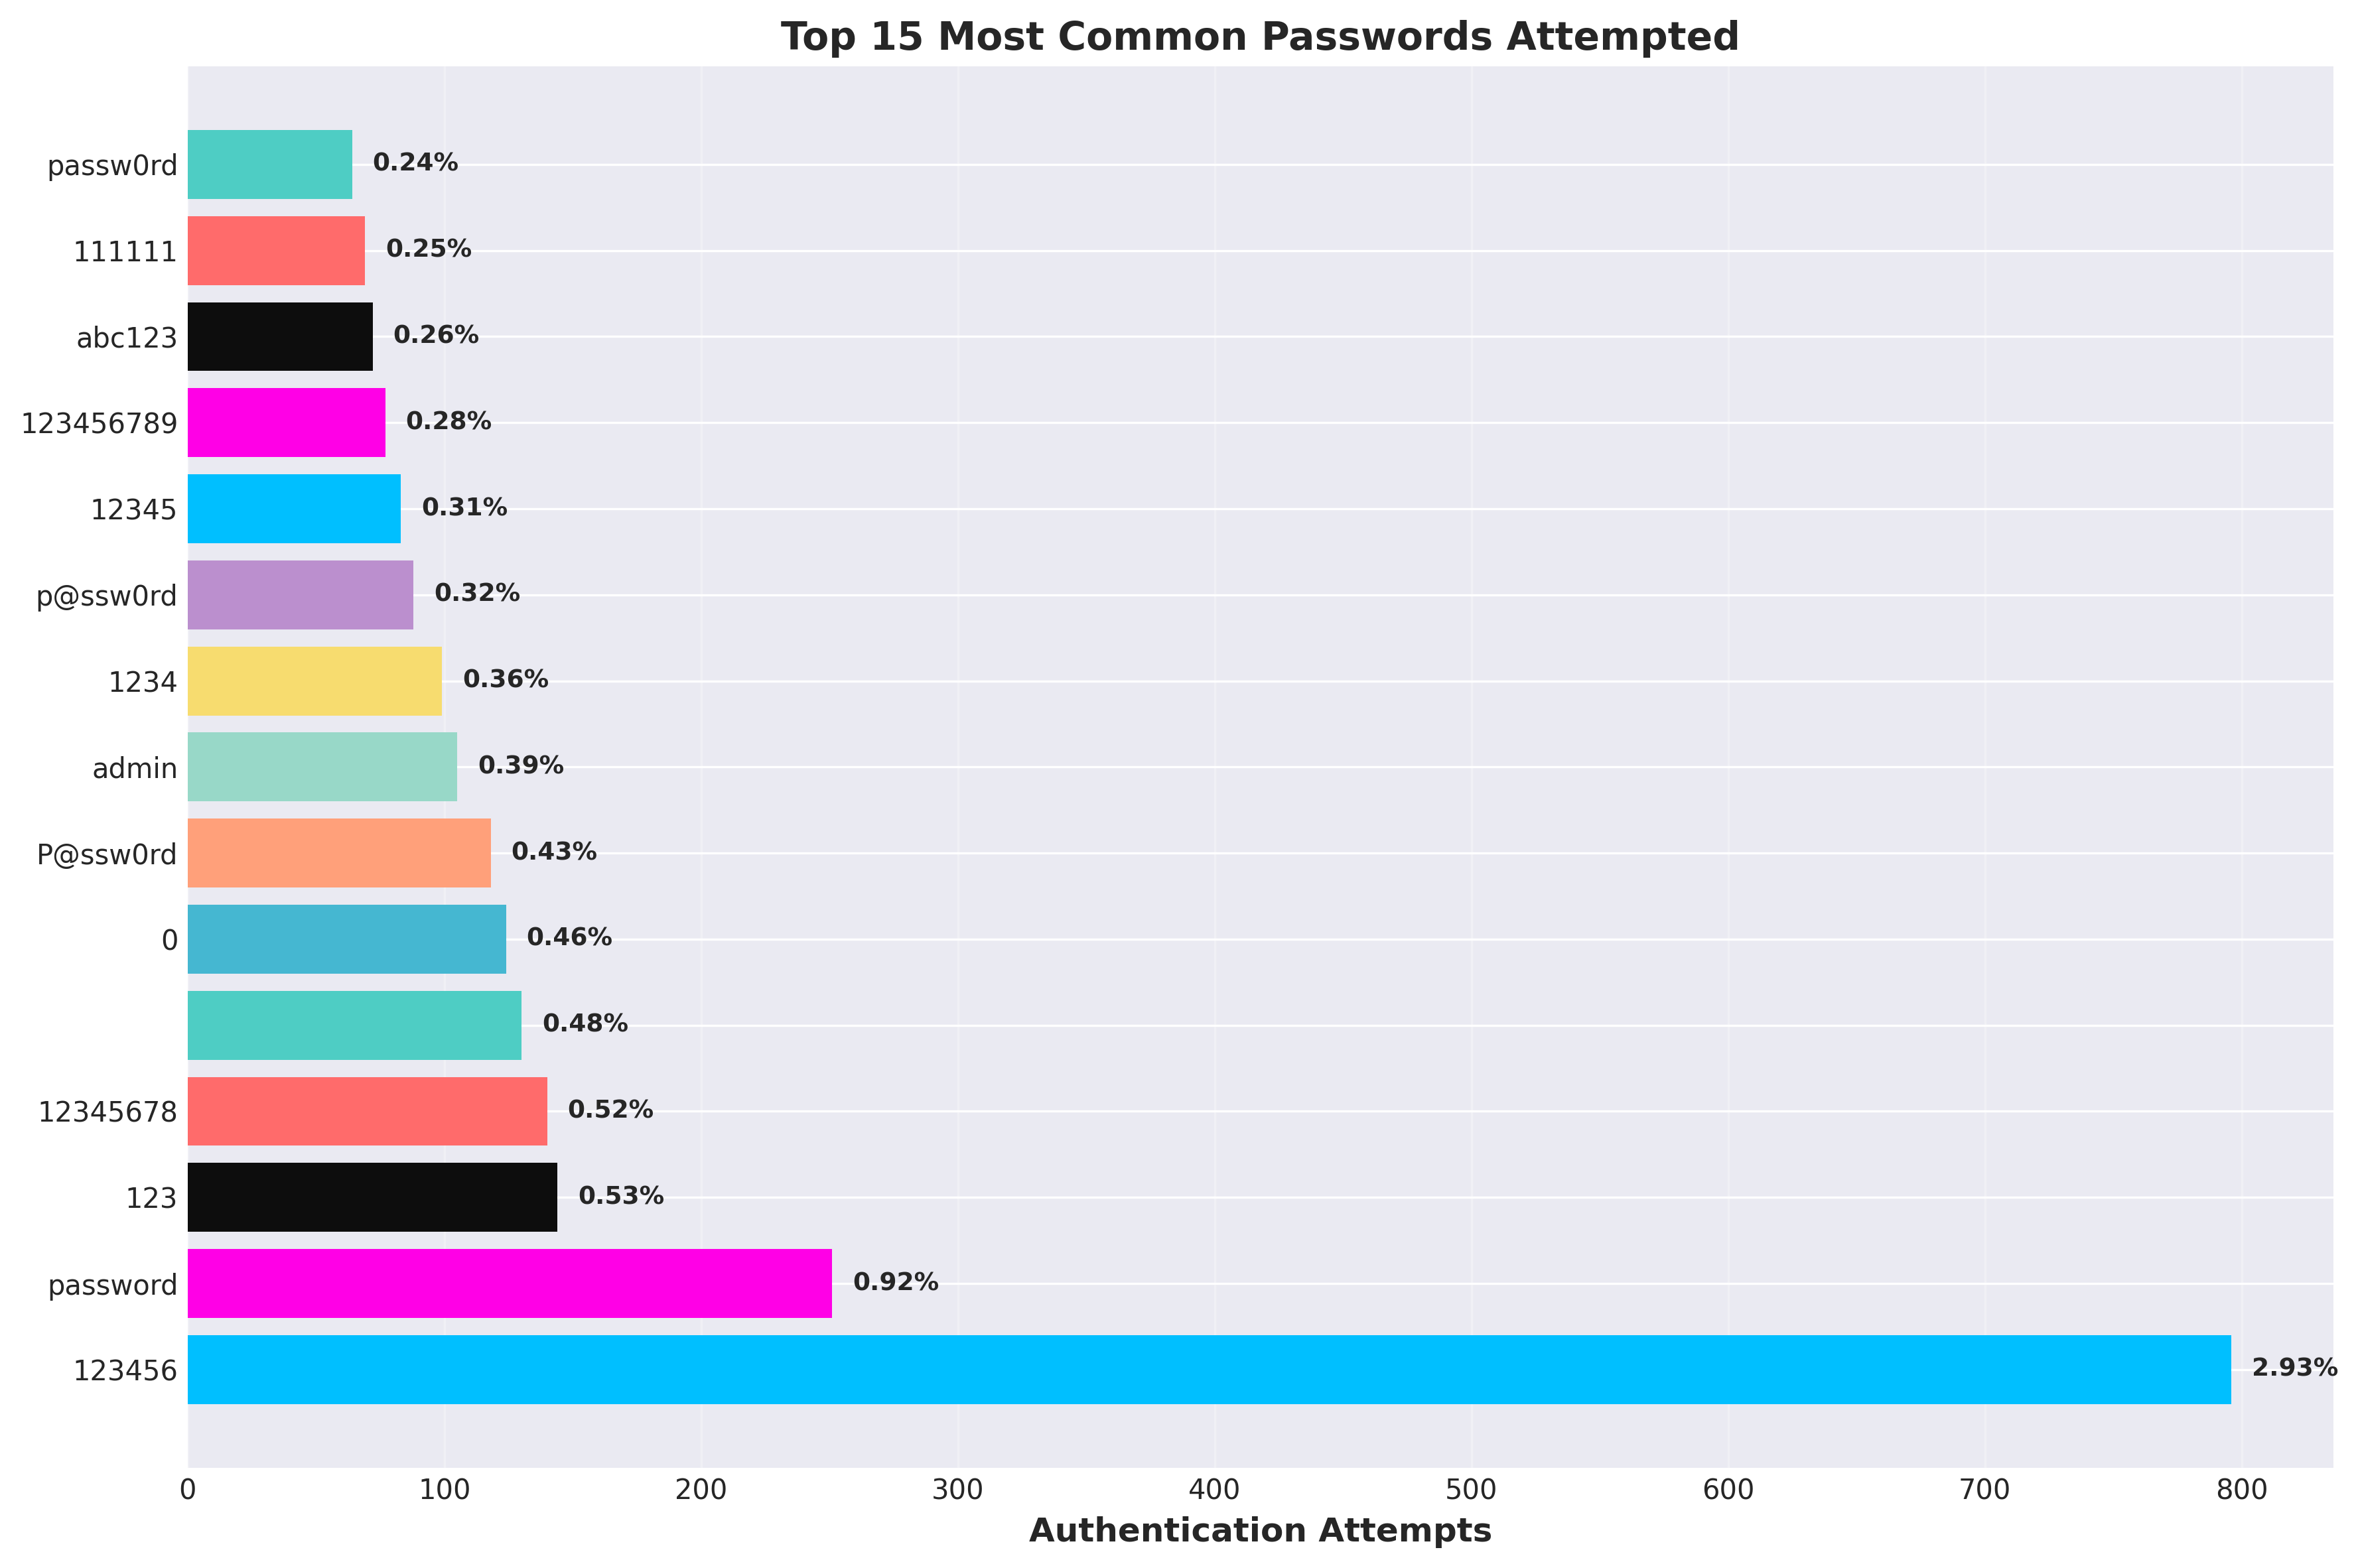
Top 10 Passwords Attempted:
123456- 796 attempts (2.9%)password- 251 attempts (0.9%)123- 144 attempts (0.5%)12345678- 140 attempts (0.5%)(empty)- 130 attempts (0.5%)0- 124 attempts (0.5%)P@ssw0rd- 118 attempts (0.4%)admin- 105 attempts (0.4%)1234- 99 attempts (0.4%)p@ssw0rd- 88 attempts (0.3%)
The top 10 passwords account for 7.3% of all authentication attempts (1,995 out of 27,179). While this percentage is lower than might be expected, the absolute numbers are significant - nearly 800 attempts using "123456" alone. This is why password policies matter - attackers are literally trying the most obvious passwords first, and they're finding success.
Attackers are targeting default accounts and service accounts (oracle, mysql, postgres, git) with weak passwords. This is a numbers game - they know that somewhere, someone has left a default password unchanged.
Low Success Rate, High Volume Strategy
Despite 27,179 authentication attempts, only 419 were successful - a 1.5% success rate. This might seem low, but it's actually quite effective for automated attacks.
Here's the math: if an attacker makes 10,000 attempts with a 1.5% success rate, they get 150 compromised systems. At scale, that's a lot of compromised infrastructure. The low success rate doesn't matter when you're running automated attacks 24/7 across thousands of targets. In this case, 27,179 attempts resulted in 419 successful compromises.
This is why volume-based attacks are so dangerous - they don't need to be sophisticated. They just need to be persistent and automated.
Port Forwarding: The Hidden Threat
One of the more interesting findings is the port forwarding data. The honeypot captured 1,007 port forwarding attempts - attempts by attackers to use compromised SSH sessions as proxy/relay networks.
This is significant because it reveals the true purpose of many SSH attacks: not direct system compromise, but creating anonymous proxy infrastructure. Attackers use compromised SSH servers to:
- Route malicious traffic anonymously
- Bypass IP-based blocking
- Create botnet command and control infrastructure
- Launch attacks from "clean" IP addresses
When you see port forwarding attempts, you're seeing attackers who have already compromised a system and are now using it as infrastructure for further attacks.
Threat Intelligence Validation
The threat intelligence data validates what we're seeing. Of the 217 IPs that were checked against AbuseIPDB:
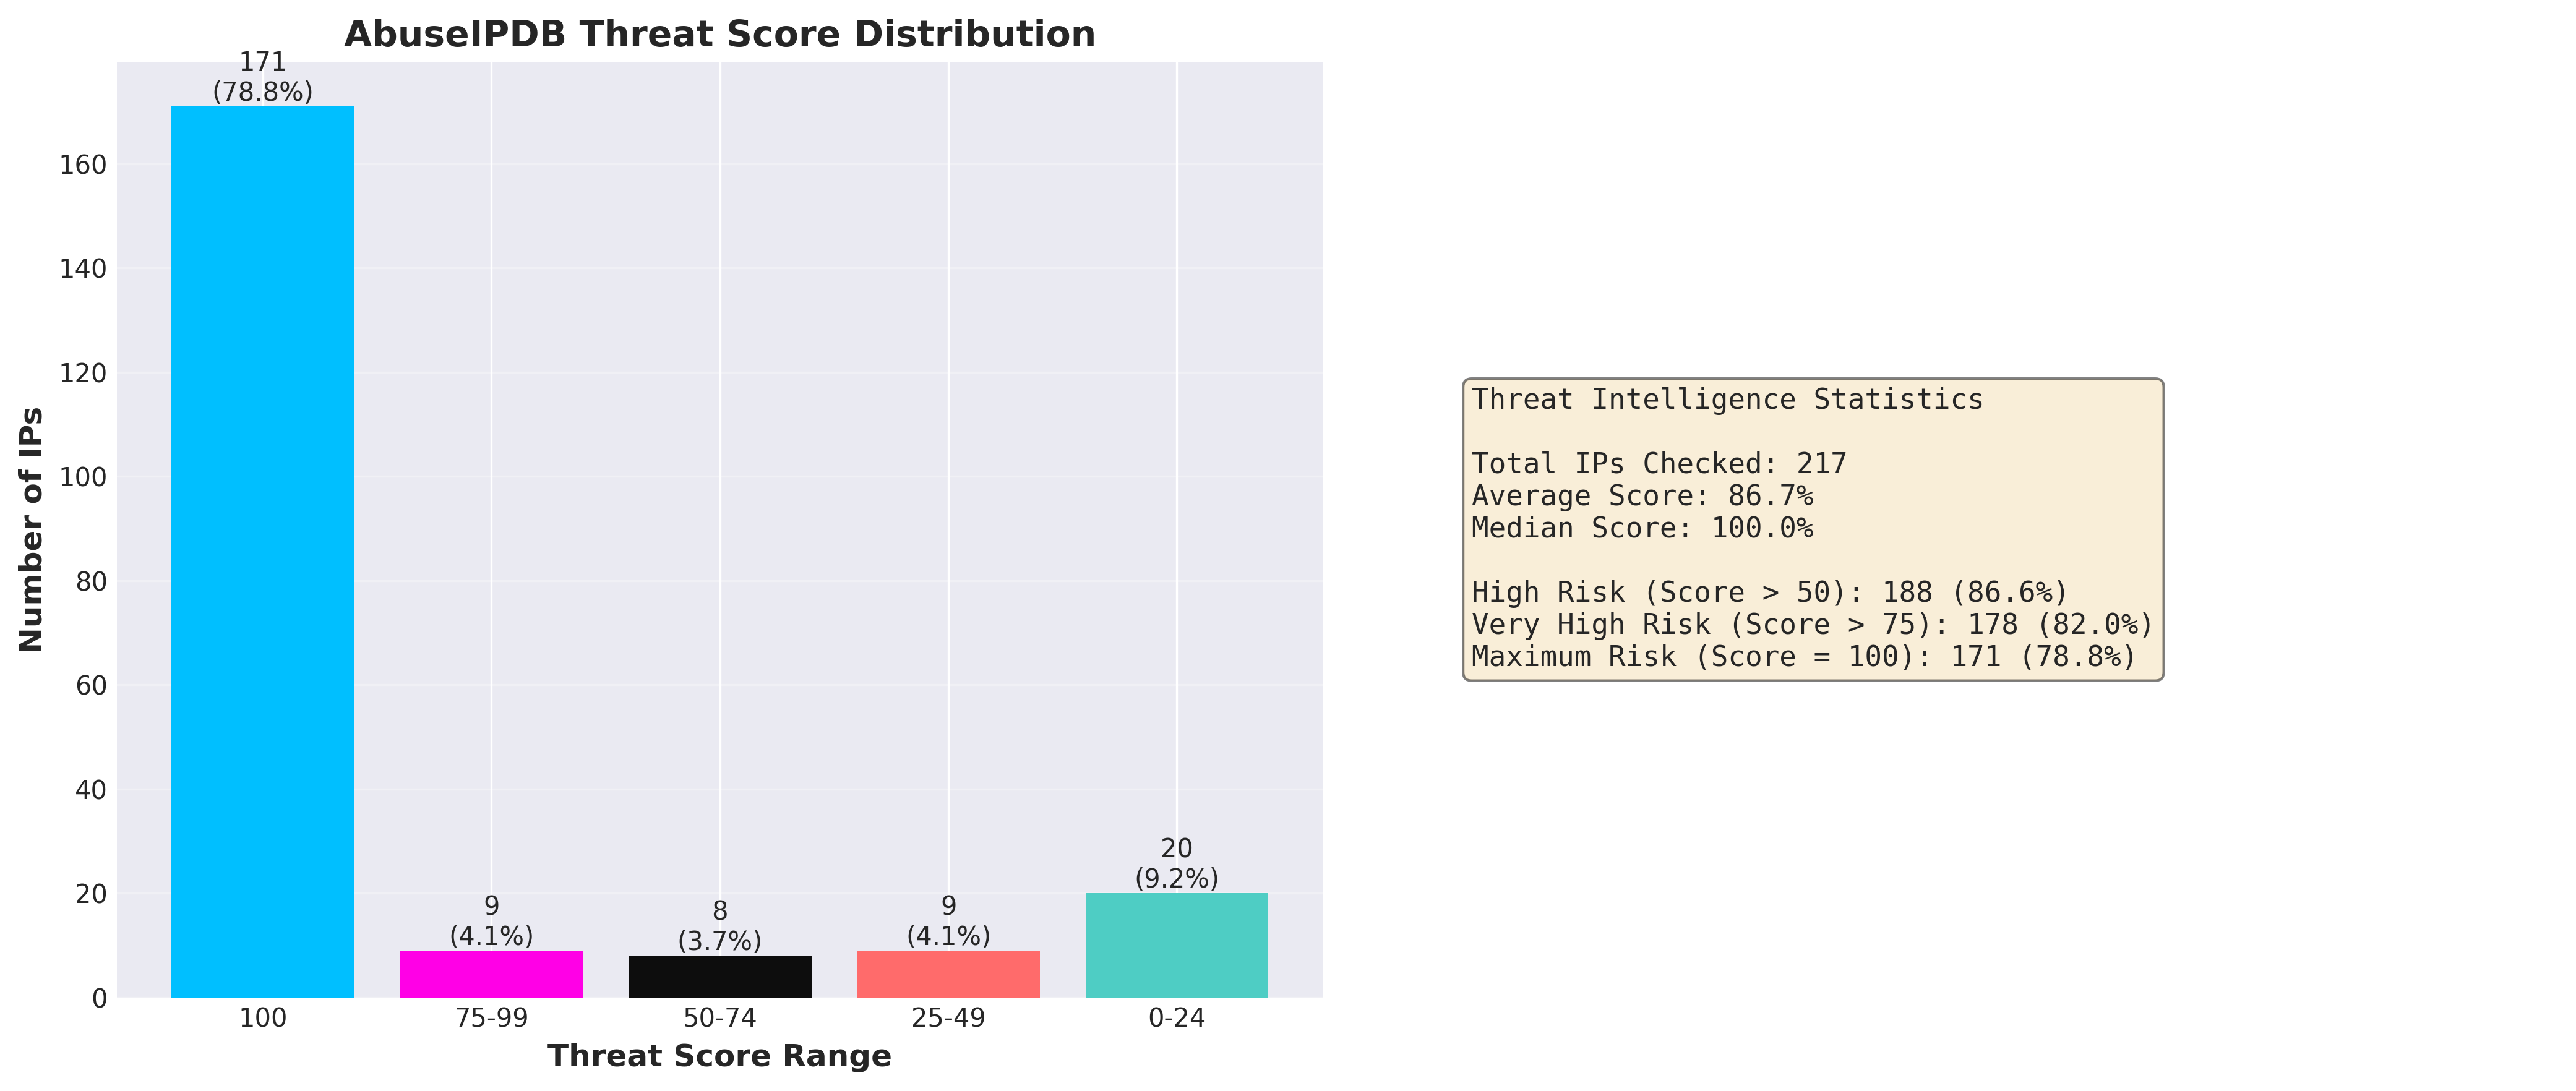
- Average threat score: 86.7% (out of 100)
- 86.6% of IPs scored above 50 (188 IPs, high risk)
- 82.0% of IPs scored above 75 (178 IPs, very high risk)
This confirms that threat intelligence feeds are highly effective at identifying malicious actors. The vast majority of attacking IPs are already known bad actors with high reputation scores.
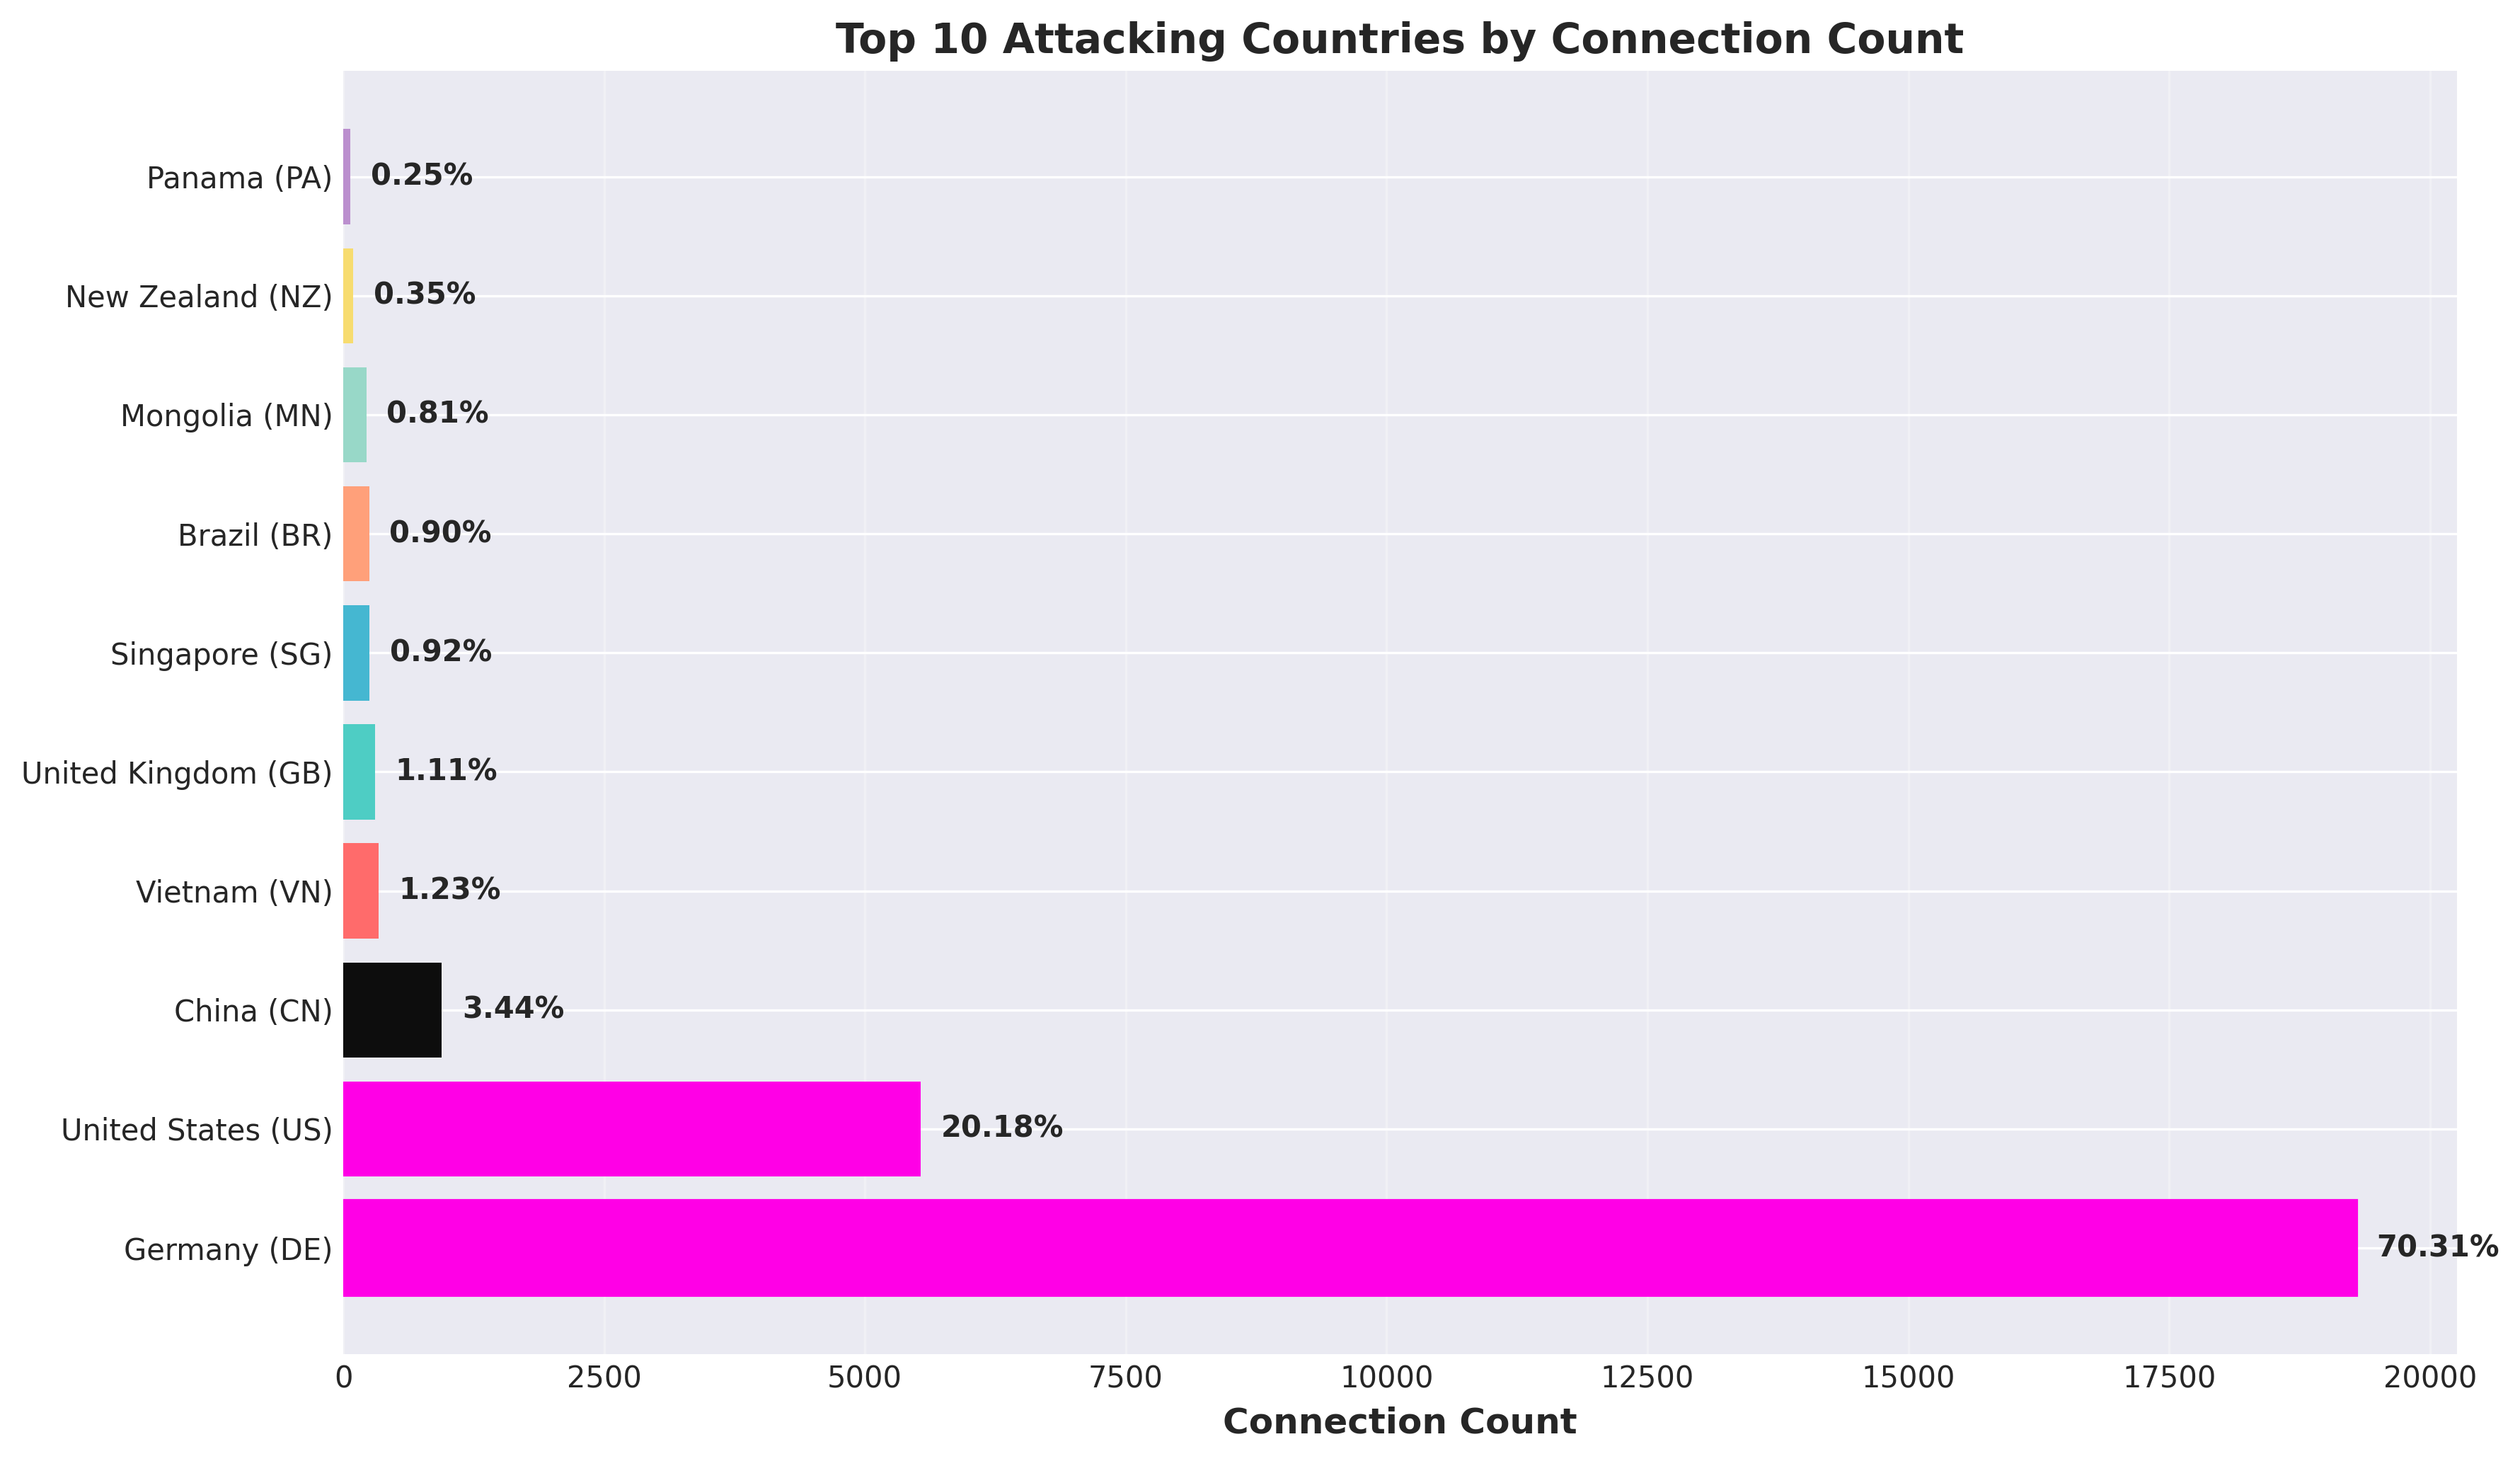
Geographic distribution shows attacks from multiple countries. When measured by connection count, Germany dominates with 19,296 connections (70.3%), but this is misleading - it's from only 3 unique IPs, with a single IP (85.215.32.66) accounting for 19,294 connections. When measured by unique IP addresses, the United States leads with 78 unique IPs contributing 5,537 connections (20.2%), followed by China with 30 unique IPs (944 connections, 3.4%), and Vietnam with 14 unique IPs (337 connections, 1.2%). This reveals a more distributed attack infrastructure than connection counts alone suggest.
Connection Duration Patterns
The connection duration data reveals two distinct attack patterns:
- Average duration: 3.88 seconds
- Median duration: 1.15 seconds
- Connections > 60 seconds: 510 (1.86%)
Most attacks are quick automated scans - the attacker connects, tries a few passwords, and moves on. But 510 connections lasted more than 60 seconds, suggesting successful compromises where attackers are actively using the system.
These longer connections are the most dangerous - they represent systems that have been successfully compromised and are now being used for malicious purposes.
Security Insights and Recommendations
What This Data Tells Us
- Automated attacks dominate: High-volume, repetitive attack patterns indicate botnet infrastructure, not human attackers. Defenses need to account for automated, high-volume attacks.
- Weak credentials are still effective: Top 10 passwords account for 7.3% of attempts, with "123456" alone accounting for 796 attempts. Password policies and multi-factor authentication are critical.
- Default accounts are prime targets:
root,admin, and service accounts are heavily targeted. Disable or rename default accounts. - Threat intelligence works: 86.6% of attacking IPs are already flagged as high-risk (188 of 217 IPs). Integrate threat intelligence feeds into your security stack.
- Port forwarding is a red flag: If you see port forwarding attempts, you may already be compromised. Monitor SSH tunnels closely.
Defensive Recommendations
- Implement fail2ban or similar: Block IPs after multiple failed login attempts
- Use key-based authentication: Disable password authentication where possible
- Change default ports: Move SSH off port 22 to reduce automated scanning
- Implement rate limiting: Limit connection attempts per IP
- Monitor for port forwarding: Alert on SSH tunnel creation attempts
- Integrate threat intelligence: Block known malicious IPs automatically
- Use strong passwords or keys: Enforce password complexity or require SSH keys
- Monitor connection durations: Long connections may indicate successful compromises
Conclusion
This analysis reveals a landscape dominated by automated botnet infrastructure, weak credential targeting, and sophisticated attack coordination. The November 28-29 surge, the extreme concentration on the root account (77.2% of all authentication attempts), and the extreme concentration of attack sources all point to the same conclusion: modern SSH attacks are highly automated, well-coordinated, and operating at massive scale.
But there's good news: the data also shows that basic security measures are effective. Strong passwords, key-based authentication, and threat intelligence integration can significantly reduce your attack surface. Even with 27,443 connection attempts, proper security controls can prevent successful compromises.
The key is understanding your attackers. By analyzing their methods, tools, and patterns, we can build better defenses. That's what threat intelligence is all about - turning attack data into actionable security insights.
📥 Want the Full Analysis?
Download the complete whitepaper with all statistics, detailed analysis, and security recommendations:
About the Data Correction
An initial version of this analysis reported significantly lower numbers: 1,898 connections from 33 unique IP addresses. Upon review, I discovered a discrepancy between the reported statistics and the actual database contents.
What Went Wrong?
The original analysis queries were likely:
- Examining the wrong database table (possibly the `connections` table from sshesame instead of `cowrie_connections`)
- Using incorrect date filters or table joins
- Missing data from the primary Cowrie honeypot system
How Was It Discovered?
During a routine review, I noticed an inconsistency: the whitepaper mentioned "193 IPs checked against AbuseIPDB" but only "33 unique IP addresses" for connections. This discrepancy prompted a deeper investigation into the SQL queries and database structure.
The Corrected Numbers
After correcting the queries to properly access the `cowrie_connections` table with the correct date range (November 24 - December 1, 2025), the actual statistics are:
- 27,443 total connections (vs. originally reported 1,898) - 14.5x more
- 172 unique IP addresses (vs. originally reported 33) - 5.2x more
- 217 IPs with threat intelligence (vs. originally reported 193) - 12% more
Why This Matters
This correction actually strengthens the conclusions of the analysis:
- The scale of attacks is even larger than initially thought - over 27,000 connection attempts in just 8 days
- The coordinated nature of attacks is more evident with the November 28-29 surge accounting for 77% of all attacks
- The threat intelligence correlation remains strong - 86.6% of IPs are flagged as high-risk
- The extreme concentration from a single IP (70.3% of all attacks) is even more remarkable
Key Lesson: Always verify your SQL queries against multiple data sources and check for inconsistencies. In this case, the discrepancy between threat intelligence IPs (193) and connection IPs (33) was the red flag that led to discovering the issue.
All statistics in this blog post and the whitepaper have been corrected and verified against the complete database.
For more details on how I built the honeypot system, check out my previous post on building the threat-intelligence SSH honeypot.